https://www.foxsports.com.au/AFL/more-t ... 3bb35e9d17
Rugby League continues to Lead The Way!
-
pussycat
- Coach

- Posts: 6620
- Joined: Fri Jul 04, 2008 10:50 pm
- Team: The Shanghai Sharks
- Location: far away
Re: Rugby League continues to Lead The Way!
Surprise , surprise LOL's, In 2016 only 7 clubs at the most made a profit . According to Gilligan himself. So in all likelihood there was probably only 3 or 4 clubs that made a profit that year. Even after some clubs were given 10 or 15 million they still lost money 
https://www.foxsports.com.au/AFL/more-t ... 3bb35e9d17
https://www.foxsports.com.au/AFL/more-t ... 3bb35e9d17
Rugby League, the dominant force in Australian sport! 
"I do like annoying the Victorians; they are so easy to get, At times I've looked at them and had a giggle." Peter V'Landys
"I do like annoying the Victorians; they are so easy to get, At times I've looked at them and had a giggle." Peter V'Landys
Re: Rugby League continues to Lead The Way!
Firstly 7 is more than 6.pussycat wrote: Tue Jun 19, 2018 3:20 pmSurprise , surprise LOL's, In 2016 only 7 clubs at the most made a profit . According to Gilligan himself. So in all likelihood there was probably only 3 or 4 clubs that made a profit that year. Even after some clubs were given 10 or 15 million they still lost money
https://www.foxsports.com.au/AFL/more-t ... 3bb35e9d17
Secondly, AFL distributions are part of their revenue given things like AFL membership fees, merchandising and other revenues are collected by the AFL then redistributed to the relevant clubs.
Thirdly, many of our clubs make massive profits, where as this year could be the first time the NRL gets even 6 clubs in the black
Re: Rugby League continues to Lead The Way!
The annual reports for the two codes are collated and reported differently & should not be used for comparison purposes. RL clubs are a separate entity to their Leagues club for the ones that have one.
A separate annual report is put out by both bodies. An NRL club does not include their attached Leagues club revenue i.e. gaming, hospitality etc in their annual report. AFL clubs report as one entity. As such any gaming or other revenue generated outside football is included in their annual reports. This amounts to tens of millions of dollars each year.
NRL Leagues clubs like Canterbury, Parramatta, Penrith, Wests etc have revenue between 50M to over 100M per year & generate huge profits. Canberra have a number of Leagues clubs & a massive property portfolio whose revenue is not counted in it's annual report. Brisbane likewise.
If all this revenue & associated profits was included in NRL club annual reports it would show hundreds of millions of dollars more money in the game.
John Grant was trying to get the reporting procedures changed so the crisis merchants couldn't have their yearly rant about 'broke' NRL clubs. He resigned before he got it through.
I hope that clears it up for ya lllllolller!
-
King-Eliagh

- Coach
- Posts: 12787
- Joined: Fri Nov 19, 2004 7:23 pm
- Team: Parramatta
- Location:
Re: Rugby League continues to Lead The Way!
Class act terry. A class act indeed. 

xman wrote:KE, why is an even comp important?
-
leeroy*NRL*
- Moderator

- Posts: 7482
- Joined: Mon Jan 19, 2015 2:54 pm
- Team: St George Illawarra Dragons
- Location: Gold Coast
Re: Rugby League continues to Lead The Way!
very well saidTerry wrote: Tue Jun 19, 2018 3:49 pmThe annual reports for the two codes are collated and reported differently & should not be used for comparison purposes. RL clubs are a separate entity to their Leagues club for the ones that have one.
A separate annual report is put out by both bodies. An NRL club does not include their attached Leagues club revenue i.e. gaming, hospitality etc in their annual report. AFL clubs report as one entity. As such any gaming or other revenue generated outside football is included in their annual reports. This amounts to tens of millions of dollars each year.
NRL Leagues clubs like Canterbury, Parramatta, Penrith, Wests etc have revenue between 50M to over 100M per year & generate huge profits. Canberra have a number of Leagues clubs & a massive property portfolio whose revenue is not counted in it's annual report. Brisbane likewise.
If all this revenue & associated profits was included in NRL club annual reports it would show hundreds of millions of dollars more money in the game.
John Grant was trying to get the reporting procedures changed so the crisis merchants couldn't have their yearly rant about 'broke' NRL clubs. He resigned before he got it through.
I hope that clears it up for ya lllllolller!
Re: Rugby League continues to Lead The Way!
Yep
As I've said before
The two codes were built on different financial models .
AFL ..crowds & memberships ...pay your membership & go along to watch .
RL ..you were encouraged to be a member of the leagues club.
That's how you contributed to your team . Spend money at the club on food drink & pokies & the profits went towards your team .
Funny thing is now the AFL clubs are getting more & more into the pokies clubs while the NRL is pushing memberships .
Doesn't make one system better than the other
They're just different.
TLPG  liar extraordinaire
You should thank me for publishing your IP
and I never published any actual IP. That's it.
I was a mod at the time .
Xman wrote
I also gave them to TLPG believing he was still a mod.I admit I made a mistake.

 liar extraordinaire
 You should thank me for publishing your IP
and I never published any actual IP. That's it.
I was a mod at the time .
Xman wrote
I also gave them to TLPG believing he was still a mod.I admit I made a mistake.
-
leeroy*NRL*
- Moderator
- Posts: 7482
- Joined: Mon Jan 19, 2015 2:54 pm
- Team: St George Illawarra Dragons
- Location: Gold Coast
Re: Rugby League continues to Lead The Way!
that is exactly correct.
I prefer the NRL's Model. so much more value in an asset, which generates income.
plus there doing the membership game and lifting numbers..
Best of both worlds.
I prefer the NRL's Model. so much more value in an asset, which generates income.
plus there doing the membership game and lifting numbers..
Best of both worlds.
Re: Rugby League continues to Lead The Way!
Theres also the moral issue of pokies/gambling, but I don't think it makes much difference to a gambler .
Fact is if someone wants to gamble they will find a way ...
Pokies get a bad rap but if there were no pokies then the gambler would be in a TAB somewhere or the casino .
Fact is if someone wants to gamble they will find a way ...
Pokies get a bad rap but if there were no pokies then the gambler would be in a TAB somewhere or the casino .
TLPG liar extraordinaire
You should thank me for publishing your IP
and I never published any actual IP. That's it.
I was a mod at the time .
Xman wrote
I also gave them to TLPG believing he was still a mod.I admit I made a mistake.
liar extraordinaire You should thank me for publishing your IP
and I never published any actual IP. That's it.
I was a mod at the time .
Xman wrote
I also gave them to TLPG believing he was still a mod.I admit I made a mistake.
-
pussycat
- Coach
- Posts: 6620
- Joined: Fri Jul 04, 2008 10:50 pm
- Team: The Shanghai Sharks
- Location: far away
Re: Rugby League continues to Lead The Way!
NRL looks for a $20 million annual windfall from new gambling tax
By Chris Roots
20 June 2018
The NRL is set to lay claim to an annual windfall of more than $20 million from the new point-of-consumption gambling taxes in NSW, Queensland and Victoria in what would be a massive boost to the game's revenue streams.
The NRL will look to follow racing, which was guaranteed $40 million a year when the tax was announced in NSW in the state budget on Tuesday. That amount will grow is indexed to grow as the income from the tax increases.
The NRL could get more than $10 million per annum from NSW alone, a figure that would double if the other states are taken into account.
The $20 million figure has potential to rise every year, with a projected growth in betting of more than 13 per cent.
The point-of-consumption tax is set to be introduced by all Australian state governments in the next 12 months to claw back traditional betting revenues that have been lost in the digital age and the NRL is looking on the new rule as an opportunity.
Fairfax Media understands the NRL has already canvassed the issue with its clubs and the funds from the windfall have been earmarked to develop the game's grassroots.
Cash is king: Betting companies sponsor a number of NRL teams.
An NRL insider said the game had been in discussions with the NSW government over the past couple of months and was confident it would gain its share of the tax.
“It is only fair to get what percentage of the market we generate and at the moment that is around 10 per cent,” the insider said. "It is [the tax] something that is being brought in in every state and we will also be making strong representations in Queensland and Victoria, where our clubs are based."
The gambling market continues to grow strongly, with forward estimates in the NSW budget predicting more than 13 per cent growth over a four-year period.
The NSW PoC tax is expected to raise $315 million in the four years to 2021-22. It was introduced to reflect the changing nature of the gaming environment due to new technology, which means punters now bet on their phones and on computers with operators that are mainly based in the Northern Territory. The PoC tax means that even though bookmakers are not based in NSW for tax purposes, they will still have to pay their share into the state coffers.
While the NRL has not got the same legislative guarantee as racing in NSW, it has already made representations to the treasurer about its share of the wagering market in NSW.
Racing NSW chief executive Peter V'Landys, who is also an NRL commissioner, worked closely with the government to ensure racing was not negatively affected by the PoC tax, securing two per cent of any bet placed by a NSW resident for the racing industry.
https://www.smh.com.au/sport/nrl/nrl-lo ... 4zmop.html
Rugby League, the dominant force in Australian sport!
"I do like annoying the Victorians; they are so easy to get, At times I've looked at them and had a giggle." Peter V'Landys
"I do like annoying the Victorians; they are so easy to get, At times I've looked at them and had a giggle." Peter V'Landys
-
pussycat
- Coach
- Posts: 6620
- Joined: Fri Jul 04, 2008 10:50 pm
- Team: The Shanghai Sharks
- Location: far away
Re: Rugby League continues to Lead The Way!
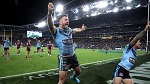
State of Origin I a multimedia success
AuthorNRL.com Timestamp
The Blues' memorable 22-12 win in the 2018 Holden State of Origin series opener on Wednesday night proved a big ratings winner for host broadcaster Channel Nine, dominating its timeslot in all markets.
With a national peak audience of 3.894 million viewers and a national average audience of 3.456 million, it was the top program across all key demographics nationally, according to Nine.
It was also the number one program in the five major cities, not just in the traditional rugby league markets of Sydney and Brisbane but in Perth, Adelaide and Melbourne, where the match was played and also resulted in a 15% increase in TV viewership compared to game one last year.
The program was also a win for Nine's 9Now streaming service, with the total 6.6 million viewing minutes making it 9Now's biggest ever live streaming event.
Origin dominated on social media on Wednesday night, becoming a trending topic on Twitter in eight countries and 46 cities and trending at No.2 worldwide.
ttps://www.nrl.com/news/2018/06/07/state-of-or ... a-success/
Rugby League, the dominant force in Australian sport!
"I do like annoying the Victorians; they are so easy to get, At times I've looked at them and had a giggle." Peter V'Landys
"I do like annoying the Victorians; they are so easy to get, At times I've looked at them and had a giggle." Peter V'Landys
-
pussycat
- Coach
- Posts: 6620
- Joined: Fri Jul 04, 2008 10:50 pm
- Team: The Shanghai Sharks
- Location: far away
Re: Rugby League continues to Lead The Way!
Social media numbers.
Facebook, Twitter. Instagram, YouTube
1 Essendon 488,775
2 Collingwood 482,760
3 Adelaide Crows 443,859
4 Hawthorn 435,679
5 Carlton 389,665
6 Sydney Swans 378,836
7 West Coast Eagles 377,440
8 Richmond 367, 185
9 Port Adelaide 302,503
10 Fremantle 286,144
11 Geelong Cats 278,415
12 St Kilda 243,190
13 Western Bulldogs 233,455
14 North Melbourne 228,595
15 Brisbane Lions 223,195
16 Melbourne 198,099
17 Gold Coast Suns 159,047
18 GWS Giants 153,017
5,669,859
1 Brisbane Broncos 783,939
2 Melbourne Storm 618,157
3 Vodafone Warriors 582,978
4 South Sydney Rabbitohs 526,522
5 Parramatta Eels 378,436
6 Canterbury-Bankstown Bulldogs 374,003
7 North Queensland Cowboys 363,462
8 Wests Tigers 346,567
9 Sydney Roosters 291,174
10 Gold Coast Titans 256,883
11 Manly Warringah Sea Eagles 249,014
12 St George Illawarra Dragons 239,200
13 Newcastle Knights 236,627
14 Cronulla Sharks 231,149
15 Penrith Panthers 206,180
16 Canberra Raiders 201,304
5,885,595
Even without NSW Blues, Qld Maroons, and Australian Kangaroos Rugby League is still the clear winner and clearly Australia's most popular sport
https://digitalsportslabs.com.au/social ... nrl-teams/
Rugby League, the dominant force in Australian sport!
"I do like annoying the Victorians; they are so easy to get, At times I've looked at them and had a giggle." Peter V'Landys
"I do like annoying the Victorians; they are so easy to get, At times I've looked at them and had a giggle." Peter V'Landys
Re: Rugby League continues to Lead The Way!
can you explain what these numbers mean? Are these accounts, members, tweets, posts, what?pussycat wrote: Mon Jul 23, 2018 1:02 pmSocial media numbers.
Facebook, Twitter. Instagram, YouTube
1 Essendon 488,775
2 Collingwood 482,760
3 Adelaide Crows 443,859
4 Hawthorn 435,679
5 Carlton 389,665
6 Sydney Swans 378,836
7 West Coast Eagles 377,440
8 Richmond 367, 185
9 Port Adelaide 302,503
10 Fremantle 286,144
11 Geelong Cats 278,415
12 St Kilda 243,190
13 Western Bulldogs 233,455
14 North Melbourne 228,595
15 Brisbane Lions 223,195
16 Melbourne 198,099
17 Gold Coast Suns 159,047
18 GWS Giants 153,017
5,669,859
1 Brisbane Broncos 783,939
2 Melbourne Storm 618,157
3 Vodafone Warriors 582,978
4 South Sydney Rabbitohs 526,522
5 Parramatta Eels 378,436
6 Canterbury-Bankstown Bulldogs 374,003
7 North Queensland Cowboys 363,462
8 Wests Tigers 346,567
9 Sydney Roosters 291,174
10 Gold Coast Titans 256,883
11 Manly Warringah Sea Eagles 249,014
12 St George Illawarra Dragons 239,200
13 Newcastle Knights 236,627
14 Cronulla Sharks 231,149
15 Penrith Panthers 206,180
16 Canberra Raiders 201,304
5,885,595
Even without NSW Blues, Qld Maroons, and Australian Kangaroos Rugby League is still the clear winner and clearly Australia's most popular sport
https://digitalsportslabs.com.au/social ... nrl-teams/
Re: Rugby League continues to Lead The Way!
Just on last year's GF's
The AFL's biggest day murders the NRL's
https://mumbrella.com.au/AFL-wins-socia ... our-479260Reflecting across the whole weekend, the AFL created 188 per cent more original social media content – 32 posts – as opposed to the NRL’s 14 posts. The AFL dominated visual content and published 14 videos, making up 44 per cent of its social media output. The NRL posted four videos.
When adding to the mix the AFL’s higher Google trends ranking (100) compared to the NRL (78), it is clear that the AFL were the true winners of the 2017 grand final, which notably was achieved with a 48 per cent smaller Facebook audience than the NRL.
The AFL's biggest day murders the NRL's
Re: Rugby League continues to Lead The Way!
Lol
Doesn't beat one of our other games .ooops ..they don't count do they ..in AFL insular world.
Doesn't beat one of our other games .ooops ..they don't count do they ..in AFL insular world.
TLPG liar extraordinaire
You should thank me for publishing your IP
and I never published any actual IP. That's it.
I was a mod at the time .
Xman wrote
I also gave them to TLPG believing he was still a mod.I admit I made a mistake.
liar extraordinaire You should thank me for publishing your IP
and I never published any actual IP. That's it.
I was a mod at the time .
Xman wrote
I also gave them to TLPG believing he was still a mod.I admit I made a mistake.
Re: Rugby League continues to Lead The Way!
Also a GF featuring a team that hadn't won in 40 years.....a fairytale.
V
A GF featuring two teams who had both won GFs in the last few years.
Lol .
V
A GF featuring two teams who had both won GFs in the last few years.
Lol .
TLPG liar extraordinaire
You should thank me for publishing your IP
and I never published any actual IP. That's it.
I was a mod at the time .
Xman wrote
I also gave them to TLPG believing he was still a mod.I admit I made a mistake.
liar extraordinaire You should thank me for publishing your IP
and I never published any actual IP. That's it.
I was a mod at the time .
Xman wrote
I also gave them to TLPG believing he was still a mod.I admit I made a mistake.